Stock ticker showing largest market capitalization cryptocurrencies all with trading session price increases

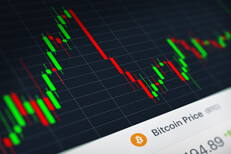
Bitcoin (BTC) stock price candlestick chart monitor screenshot showing volatility and price increases and declines

Computer monitor screenshot of cryptocurrency markets showing market capitalization and recent price change

Stock ticker showing largest market capitalization cryptocurrencies all with trading session price declines

Bitcoin overlaid on stock price candlestick chart with circuit background

Tablet on desk with coffee cup and cell phone showing Bitcoin cryptocurrency logo and stock price candlestick chart

Stock ticker chart showing cryptocurrency prices with Bitcoin price decline highlighted

Stock ticker chart showing cryptocurrency prices with Bitcoin price increase highlighted

Neo cryptocurrency token overlaid on stock price candlestick chart and subtle circuit background

Ripple XRP cryptocurrency token overlaid on stock price candlestick chart and subtle circuit background

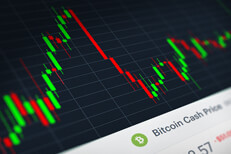
Bitcoin Cash (BCH) stock price candlestick chart monitor screenshot showing volatility and price increases and declines

Stock ticker chart showing cryptocurrency prices with Litecoin price decrease highlighted

Stock ticker chart showing cryptocurrency prices with EOS price increase highlighted

Computer monitor screenshot of Bitcoin (BTC) stock price chart

Stock ticker chart showing cryptocurrency prices with Ripple price decline highlighted

Stock ticker chart showing many cryptocurrency stocks with all prices down for the session in red

Stock ticker chart showing cryptocurrency prices with Ethereum price increase highlighted

Stock ticker chart showing cryptocurrency prices with Litecoin price increase highlighted

Stock ticker chart showing cryptocurrency prices with Ethereum price decline highlighted

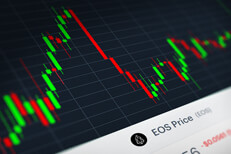
EOS crytocurrency stock price candlestick chart monitor screenshot showing volatility and price increases and declines

Stock ticker chart showing many cryptocurrency stocks with all prices up for the session in green

EOS cryptocurrency token overlaid on stock price candlestick chart

Stock ticker chart showing cryptocurrency prices with Stellar price decline highlighted

Stellar cryptocurrency token overlaid on stock price candlestick chart and subtle circuit background

Stock ticker chart showing cryptocurrency prices with Ripple price increase highlighted

Computer monitor showing stock prices and market cap for Ethereum, Bitcoin Cash, Stellar, EOS, and Litecoin

Stock ticker chart showing cryptocurrency prices with EOS price decline highlighted

Tablet on desk with coffee cup and cell phone showing Stellar cryptocurrency logo and stock price candlestick chart

Stock ticker chart showing cryptocurrency prices with Stellar price increase highlighted

Ripple (XRP) stock price candlestick chart monitor screenshot showing volatility and price increases and declines

Computer monitor screenshot of Ripple (XRP) stock price chart

Ethereum (ETH) stock price candlestick chart monitor screenshot showing volatility and price increases and declines

Computer monitor screenshot of Ethereum (ETH) stock price chart

Basic Attention Token (BAT) stock price candlestick chart monitor screenshot showing volatility and price increases and declines

Monero (XMR) stock price candlestick chart monitor screenshot showing volatility and price increases and declines

Computer monitor screenshot of Monero (XMR) stock price chart

Tablet on desk with coffee cup and cell phone showing Ripple cryptocurrency logo and stock price candlestick chart

Ethereum cryptocurrency token overlaid on stock price candlestick chart

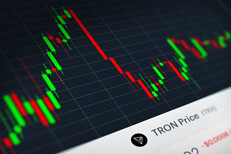
Tron (TRX) stock price candlestick chart monitor screenshot showing volatility and price increases and declines

Computer monitor screenshot of Tron (TRX) stock price chart

Tablet on desk with coffee cup and cell phone showing Monero cryptocurrency logo and stock price candlestick chart

Tablet on desk with coffee cup and cell phone showing Tron cryptocurrency logo and stock price candlestick chart

Tron cryptocurrency token overlaid on stock price candlestick chart and subtle circuit background

Zcash cryptocurrency token overlaid on stock price candlestick chart and subtle circuit background

Dash cryptocurrency token overlaid on stock price candlestick chart and subtle circuit background

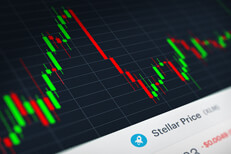
Stellar (XLM) stock price candlestick chart monitor screenshot showing volatility and price increases and declines

Computer monitor screenshot of Stellar (XLM) stock price chart

Bitcoin on iPhone with mobile trading app screen stock prices and volume

Tablet on desk with coffee cup and cell phone showing Neo cryptocurrency logo and stock price candlestick chart

Tablet on desk with coffee cup and cell phone showing XRP cryptocurrency logo and stock price candlestick chart

Monero cryptocurrency token overlaid on stock price candlestick chart and subtle circuit background

Computer monitor screenshot of Litecoin stock price chart

Tablet on desk with coffee cup and cell phone showing Ethereum cryptocurrency logo and stock price candlestick chart

Bitcoin logo on stock price area chart with stack of Bitcoins

Tablet on desk with coffee cup and cell phone showing Litecoin cryptocurrency logo and stock price candlestick chart

Tablet on desk with coffee cup and cell phone showing Cardano cryptocurrency logo and stock price candlestick chart

Tablet on desk with coffee cup and cell phone showing Nem cryptocurrency logo and stock price candlestick chart

Iota cryptocurrency token overlaid on stock price candlestick chart and subtle circuit background

3D Bitcoin logo hanging on wall showing BTC price area chart

3D Bitcoin logo hanging on wall showing candlestick chart for BTC stock price

Computer monitor screenshot of Cardano stock price chart

Laptop screen showing BTC stock price area chart and trading info

Ethereum, Litecoin, and Bitcoin on blue stock price candlestick chart

Ethereum coin reflecting stock price chart on Apple MacBook Pro keyboard

Two Bitcoins on laptop screen showing BTC price area chart with sharp decline and recovery

Free photo of Litecoin cryptocurrency token on laptop keyboard reflecting stock price area chart

Bitcoin with reflection in front of monitor showing stock price and volatility

BTCUSD stock price candlestick chart

Two Bitcoins on surface showing blue stock price candlestick chart

Ethereum, Litecoin, and Bitcoin on edge in front of stock price candlestick chart

Laptop screen showing BTC Bitcoin stock price information

Bitcoin on reflective surface reflecting candlestick chart from monitor

Bitcoin reflecting candlestick chart showing stock price rise and declines

Bitcoin reflecting BTC stock price candlestick chart showing rise and decline

Row of Bitcoins reflecting stock price candlestick chart in background

BTCUSD stock price candlestick chart at an angle with perspective blur

Two Bitcoins on BTCUSD stock price area chart

Bitcoin on edge in front of monitor showing BTC stock price area chart

Ethereum coin and Bitcoin on stock price candlestick chart

Bitcoins reflecting computer screen showing stock price charts and trading volume

BTCUSD stock price candlestick chart showing steep climb and fall

Bitcoin on edge in front of monitor showing BTC candlestick price change and trading volume

Monitor showing BTC stock price volatility with Bitcoins

Row of Bitcoins reflecting stock price chart in computer monitor

Bitcoin reflecting BTC stock price volatility and trading volume

Bitcoin laying on blue stock price candlestick chart

Bitcoin laying on blue stock price candlestick chart

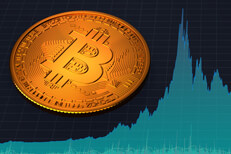
Area chart showing BTCUSD stock price rise and fall with large Bitcoin in corner

Area chart showing BTCUSD stock price falling from peak high with Bitcoin overlaid

Area chart showing Bitcoin BTCUSD stock price climbing and then falling over time

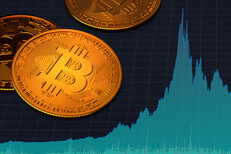
Area chart showing Bitcoin BTCUSD stock price area chart with three shiny Bitcoins overlaid

Broken Bitcoin lying on area chart showing stock price of BTCUSD declining

Broken Bitcoin lying on blue circuit board representing price decline of cryptocurrencies

Single Bitcoin on edge in front of monitor showing increasing stock price of Bitcoin and BTCUSD

Pile of Bitcoins with blue and gold lighting representing hot and cold or Bitcoin stock price volatility

Area chart showing Bitcoin price decline over time with single Bitcoin in corner of chart

Bitcoin standing on edge on reflective surface with green BTC stock price area chart in background

Pile of random Bitcoins illuminated by two blue lights symbolizing price decline or a bear market

Pile of Bitcoins with gold and blue lighting representing hot and cold or Bitcoin stock price volatility

Bitcoin standing on edge on reflective surface with blue BTC stock price area chart in background

Small stack of Bitcoins in front of blue market area chart showing sharp rise and fall in Bitcoin price

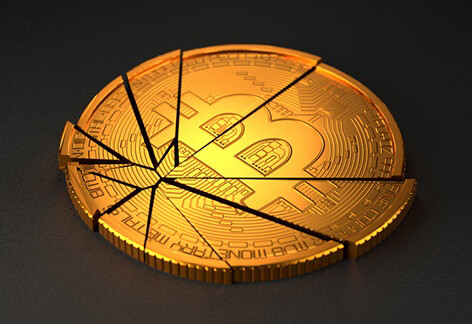
Concept of Bitcoin price drop, market volatility, or cryptocurrency market crash showing broken or cracked Bitcoin

Small stack of Bitcoins in front of monitor showing market area chart and price volatility in blue

Broken Bitcoin on dark background concept for price crash, market crash, or devaluation

Small stack of Bitcoins in front of market trade monitor showing green area chart for price volatility

Broken Bitcoin concept for falling prices, cryptocurrency market crash, or price volatility

Small stack of Bitcoins in front of monitor showing blue area chart with cryptocurrency price fluctuations

Broken Bitcoin with spot lighting representing cryptocurrency market crash or steep price decline

Bitcoin vertical on laptop keyboard in front of blue price volatility area chart on screen

Stack of Bitcoins in front of trading price volatility area chart with stylized overlay and light effect

