Computer screen showing stock price candlesticks with other market price indicators

Stock area chart and candlestick chart with overlay and lens flare effects

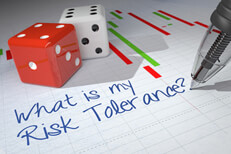
Dice on stock candlestick chart with pen writing What is my Risk Tolerance

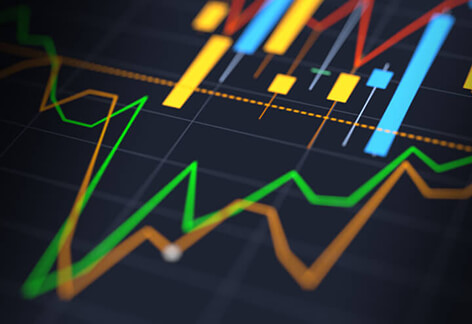
Blue and yellow candlestick chart showing stock price volatility

Close up view of rolls of money next to bright stock price candlestick chart

Candlestick chart for one stock compared to other market index line charts

Sell keyboard key on stock price candlestick chart representing stock sale

Buy key from laptop on top of stock candlestick chart showing stock price ranges by day

Dart sticking out of screenshot of stock price candlestick chart

Computer screenshots of area and candlestick charts for stock prices reflected

Line and candlestick charts showing stock prices with lens flare and overlay

Computer screen showing stock prices with price range and fluctuation

Stock price area chart reflecting into glossy surface showing stock price candlestick chart

Computer screens showing stock price area chart, trading volume, and candlestick price changes

Stylized screenshots of stock price area and candlestick charts

Screen showing stock price area chart and price candlestick chart

Closeup of candlestick stock price chart with lens flare and overlay

Stock price area chart and trading volume reflected in glossy candlestick chart

Two bundles of U.S. paper bills on stock price line chart and candlestick chart

Shallow depth of field view of stock price area chart and candlestick chart

Concept of speculation risk showing red dice on candlestick and line charts for stock and market prices
