Computer screen showing stock price candlesticks with other market price indicators

Stock area chart and candlestick chart with overlay and lens flare effects

Paper with asset and risk allocation pie charts with ink pen and glasses on table

Large roll of U.S. bills laying on top of line charts showing massive stock price fluctuation

Paper with investment charts and words Investing vs Speculating written with ballpoint pen

Candlestick chart for one stock compared to other market index line charts

Money rolls sitting on stock price line charts

Stock price charts showing volatility of stock prices over time

Stock price area chart with other market indicators overlaid as line charts

Computer monitor showing various stock price charts

Computer screenshots of area and candlestick charts for stock prices reflected

Screen showing stock price area chart compared to overall market return line charts

Screenshot of stock price area chart and market indicator line charts

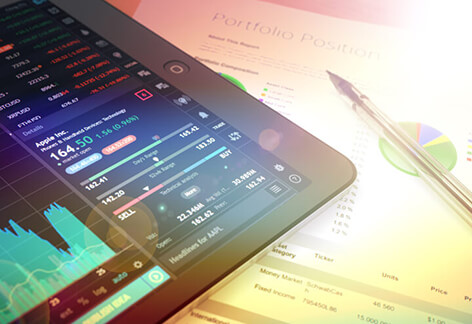
iPad on table showing stock trading data with pen and pie chart on paper

Line and candlestick charts showing stock prices with lens flare and overlay

Computer screens showing stock price area chart, trading volume, and candlestick price changes

Stock price chart with shallow depth-of-field

Stylized screenshots of stock price area and candlestick charts

Shiny gold piggy bank on stock price charts representing investments

Shallow depth of field view of stock price area chart and candlestick chart

Concept of speculation risk showing red dice on candlestick and line charts for stock and market prices
