Jaguar F-Pace Insurance Rates
Enter your zip code below to view companies that have cheap auto insurance rates.
Michelle Robbins
Licensed Insurance Agent
Michelle Robbins has been a licensed insurance agent for over 13 years. Her career began in the real estate industry, supporting local realtors with Title Insurance. After several years, Michelle shifted to real estate home warranty insurance, where she managed a territory of over 100 miles of real estate professionals. Later, Agent Robbins obtained more licensing and experience serving families a...
Licensed Insurance Agent
UPDATED: Jun 11, 2024
It’s all about you. We want to help you make the right coverage choices.
Advertiser Disclosure: We strive to help you make confident car insurance decisions. Comparison shopping should be easy. We are not affiliated with any one car insurance provider and cannot guarantee quotes from any single provider.
Our insurance industry partnerships don’t influence our content. Our opinions are our own. To compare quotes from many different companies please enter your ZIP code on this page to use the free quote tool. The more quotes you compare, the more chances to save.
Editorial Guidelines: We are a free online resource for anyone interested in learning more about auto insurance. Our goal is to be an objective, third-party resource for everything auto insurance related. We update our site regularly, and all content is reviewed by auto insurance experts.
Average insurance rates for a Jaguar F-Pace are $1,830 a year for full coverage. Comprehensive costs an estimated $398 each year, collision costs $822, and liability costs around $452. A policy with just liability insurance costs as low as $504 a year, with coverage for high-risk drivers costing around $3,998. Teenage drivers receive the highest rates at $6,696 a year or more.
Average premium for full coverage: $1,830
Rate estimates broken down by individual coverage type:
Full coverage includes $500 policy deductibles, liability coverage up to 30/60, and includes medical and uninsured motorist coverage. Rates are averaged for all states and F-Pace models.
Price Range by Coverage and Risk
For the normal driver, prices range go from as low as $504 for just liability coverage to a high rate of $3,998 for a high-risk driver policy.
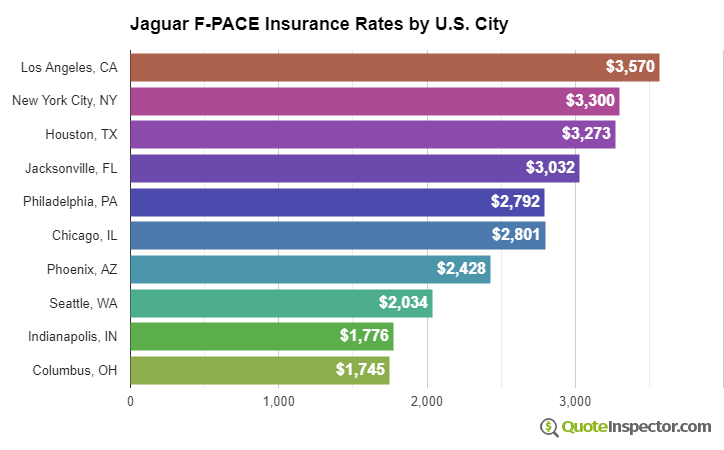
Price Range by Location
Where you live can have significant affects on insurance rates. More rural locations tend to have a lower frequency of accident claims than densely populated cities.
The graphic below illustrates how geographic area affects insurance prices.
These examples show why all drivers should compare prices for a targeted area and risk profile, instead of using average rates.
Use the form below to get customized rates for your location.
Enter your zip code below to view companies based on your location that have cheap auto insurance rates.
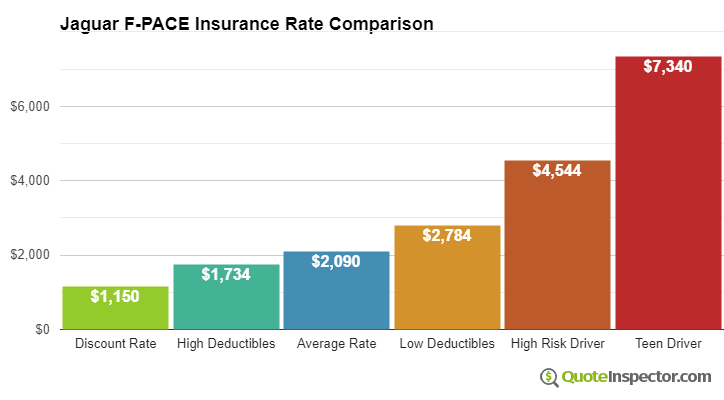
Detailed Rate Analysis
The chart below shows estimated Jaguar F-Pace insurance rates for other coverage scenarios.
- The best discount rate is $1,017
- Using higher $1,000 deductibles will save approximately $276 a year
- The average rate for a 40-year-old driver who has $500 deductibles is $1,830
- Using low deductibles for physical damage coverage will increase the cost to $2,374
- Drivers who are prone to accidents and violations could pay up to $3,998 or more
- The cost for full coverage for a teen driver can cost as much as $6,696 or more
Insurance rates for a Jaguar F-Pace can also vary considerably based on your driver profile, the trim level of your F-Pace, and liability limits and deductibles.
More mature drivers with no violations or accidents and high deductibles may pay as little as $1,700 a year for full coverage. Rates are much higher for teen drivers, where even good drivers should be prepared to pay at least $6,600 a year. View Rates by Age
Where you live has a huge impact on Jaguar F-Pace insurance prices. A driver around age 40 might see rates as low as $1,210 a year in states like Iowa, Maine, and Idaho, or be forced to pay as much as $2,610 on average in New York, Louisiana, and Michigan.
| State | Premium | Compared to U.S. Avg | Percent Difference |
|---|---|---|---|
| Alabama | $1,656 | -$174 | -9.5% |
| Alaska | $1,404 | -$426 | -23.3% |
| Arizona | $1,518 | -$312 | -17.0% |
| Arkansas | $1,830 | -$0 | 0.0% |
| California | $2,086 | $256 | 14.0% |
| Colorado | $1,748 | -$82 | -4.5% |
| Connecticut | $1,882 | $52 | 2.8% |
| Delaware | $2,070 | $240 | 13.1% |
| Florida | $2,290 | $460 | 25.1% |
| Georgia | $1,690 | -$140 | -7.7% |
| Hawaii | $1,314 | -$516 | -28.2% |
| Idaho | $1,240 | -$590 | -32.2% |
| Illinois | $1,364 | -$466 | -25.5% |
| Indiana | $1,378 | -$452 | -24.7% |
| Iowa | $1,234 | -$596 | -32.6% |
| Kansas | $1,740 | -$90 | -4.9% |
| Kentucky | $2,496 | $666 | 36.4% |
| Louisiana | $2,710 | $880 | 48.1% |
| Maine | $1,130 | -$700 | -38.3% |
| Maryland | $1,508 | -$322 | -17.6% |
| Massachusetts | $1,464 | -$366 | -20.0% |
| Michigan | $3,180 | $1,350 | 73.8% |
| Minnesota | $1,532 | -$298 | -16.3% |
| Mississippi | $2,192 | $362 | 19.8% |
| Missouri | $1,624 | -$206 | -11.3% |
| Montana | $1,966 | $136 | 7.4% |
| Nebraska | $1,444 | -$386 | -21.1% |
| Nevada | $2,196 | $366 | 20.0% |
| New Hampshire | $1,318 | -$512 | -28.0% |
| New Jersey | $2,046 | $216 | 11.8% |
| New Mexico | $1,620 | -$210 | -11.5% |
| New York | $1,926 | $96 | 5.2% |
| North Carolina | $1,056 | -$774 | -42.3% |
| North Dakota | $1,500 | -$330 | -18.0% |
| Ohio | $1,264 | -$566 | -30.9% |
| Oklahoma | $1,878 | $48 | 2.6% |
| Oregon | $1,676 | -$154 | -8.4% |
| Pennsylvania | $1,746 | -$84 | -4.6% |
| Rhode Island | $2,440 | $610 | 33.3% |
| South Carolina | $1,656 | -$174 | -9.5% |
| South Dakota | $1,544 | -$286 | -15.6% |
| Tennessee | $1,602 | -$228 | -12.5% |
| Texas | $2,206 | $376 | 20.5% |
| Utah | $1,354 | -$476 | -26.0% |
| Vermont | $1,252 | -$578 | -31.6% |
| Virginia | $1,096 | -$734 | -40.1% |
| Washington | $1,414 | -$416 | -22.7% |
| West Virginia | $1,676 | -$154 | -8.4% |
| Wisconsin | $1,268 | -$562 | -30.7% |
| Wyoming | $1,630 | -$200 | -10.9% |
Using high physical damage deductibles could cut rates by as much as $820 every year, whereas increasing liability limits will increase premiums. Going from a 50/100 limit to a 250/500 limit will cost as much as $407 more each year. View Rates by Deductible or Liability Limit
If you like to drive fast or tend to cause accidents, you could be paying $2,200 to $3,000 additional per year, depending on your age. Insurance for high-risk drivers can be as much as 45% to 134% more than a normal policy. View High Risk Driver Rates
With so much variability in rates, the only way to know which company is cheapest is to do a rate comparison and see which company has the best rate. Each insurance company uses a different method to calculate rates, and rates can be significantly different from one company to the next.
| Model Year | Comprehensive | Collision | Liability | Total Premium |
|---|---|---|---|---|
| 2024 Jaguar F-Pace | $470 | $982 | $398 | $2,008 |
| 2023 Jaguar F-Pace | $454 | $958 | $416 | $1,986 |
| 2022 Jaguar F-Pace | $438 | $918 | $430 | $1,944 |
| 2021 Jaguar F-Pace | $414 | $886 | $442 | $1,900 |
| 2020 Jaguar F-Pace | $398 | $822 | $452 | $1,830 |
| 2019 Jaguar F-Pace | $382 | $774 | $456 | $1,770 |
| 2018 Jaguar F-Pace | $366 | $694 | $460 | $1,678 |
| 2017 Jaguar F-Pace | $342 | $638 | $460 | $1,598 |
| 2016 Jaguar F-Pace | $330 | $598 | $464 | $1,550 |
Rates are averaged for all Jaguar F-Pace models and trim levels. Rates assume a 40-year-old male driver, full coverage with $500 deductibles, and a clean driving record.
How to Find More Affordable Jaguar F-Pace Insurance
Saving money on car insurance requires avoiding accidents and claims, having a good credit history, eliminating unneeded coverage, and maximizing policy discounts. Invest the time to compare rates every time your policy renews by getting quotes from direct carriers like GEICO and Progressive, and also from local independent and exclusive agents.
The points below are a summary of the information presented in the illustrations above.
- Drivers can save approximately $230 per year simply by quoting online in advance
- Drivers under the age of 20 are expensive to insure, costing as high as $558 per month including comprehensive and collision insurance
- Increasing deductibles can save around $825 each year
- Higher risk drivers who have multiple accidents or major violations pay an average of $2,170 more annually to insure a Jaguar F-Pace
- Policyholders who want increased liability limits will pay an extra $500 each year to increase from a minimum limit to 250/500 limits
Rate Tables and Charts
Rates by Driver Age
| Driver Age | Premium |
|---|---|
| 16 | $6,696 |
| 20 | $4,264 |
| 30 | $1,924 |
| 40 | $1,830 |
| 50 | $1,670 |
| 60 | $1,640 |
Full coverage, $500 deductibles
Rates by Deductible
| Deductible | Premium |
|---|---|
| $100 | $2,374 |
| $250 | $2,120 |
| $500 | $1,830 |
| $1,000 | $1,554 |
Full coverage, driver age 40
Rates by Liability Limit
| Liability Limit | Premium |
|---|---|
| 30/60 | $1,830 |
| 50/100 | $1,920 |
| 100/300 | $2,033 |
| 250/500 | $2,327 |
| 100 CSL | $1,966 |
| 300 CSL | $2,214 |
| 500 CSL | $2,395 |
Full coverage, driver age 40
Rates for High Risk Drivers
| Age | Premium |
|---|---|
| 16 | $9,622 |
| 20 | $6,804 |
| 30 | $4,102 |
| 40 | $3,998 |
| 50 | $3,816 |
| 60 | $3,784 |
Full coverage, $500 deductibles, two speeding tickets, and one at-fault accident
If a financial responsibility filing is required, the additional charge below may also apply.
Potential Rate Discounts
If you qualify for discounts, you may save the amounts shown below.
| Discount | Savings |
|---|---|
| Multi-policy | $100 |
| Multi-vehicle | $98 |
| Homeowner | $26 |
| 5-yr Accident Free | $146 |
| 5-yr Claim Free | $122 |
| Paid in Full/EFT | $91 |
| Advance Quote | $96 |
| Online Quote | $134 |
| Total Discounts | $813 |
Discounts are estimated and may not be available from every company or in every state.
Compare Rates and Save
Find companies with the cheapest rates in your area