
Land Rover Range Rover Insurance Rates
Enter your zip code below to view companies that have cheap auto insurance rates.
UPDATED: Apr 14, 2024
It’s all about you. We want to help you make the right coverage choices.
Advertiser Disclosure: We strive to help you make confident car insurance decisions. Comparison shopping should be easy. We are not affiliated with any one car insurance provider and cannot guarantee quotes from any single provider.
Our insurance industry partnerships don’t influence our content. Our opinions are our own. To compare quotes from many different companies please enter your ZIP code on this page to use the free quote tool. The more quotes you compare, the more chances to save.
Editorial Guidelines: We are a free online resource for anyone interested in learning more about auto insurance. Our goal is to be an objective, third-party resource for everything auto insurance related. We update our site regularly, and all content is reviewed by auto insurance experts.
Average insurance rates for a Land Rover Range Rover are $1,700 a year including full coverage. Comprehensive costs approximately $382, collision costs $704, and liability insurance is estimated at $456. Buying just liability costs approximately $508 a year, with insurance for high-risk drivers costing around $3,692. 16-year-old drivers receive the highest rates at $6,232 a year or more.
Average premium for full coverage: $1,700
Rate estimates by individual coverage type:
Full coverage includes $500 policy deductibles, minimum liability limits, and includes medical and uninsured motorist coverage. Rates are averaged for all 50 U.S. states and for different Range Rover trim levels.
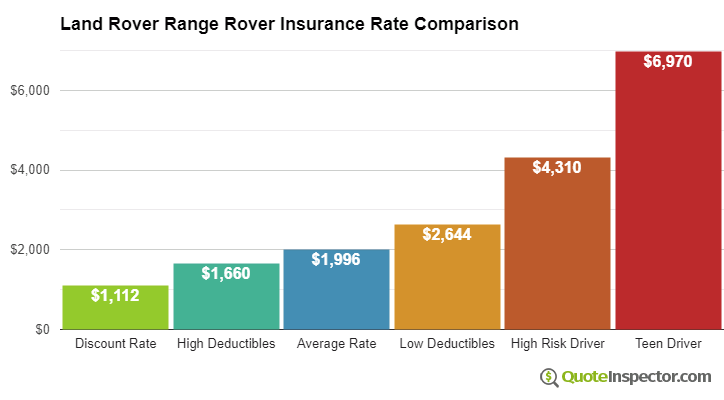
Price Range by Coverage and Risk
Using a middle-aged driver as an example, prices range go from as low as $508 for just liability coverage to a much higher rate of $3,692 for high-risk insurance.
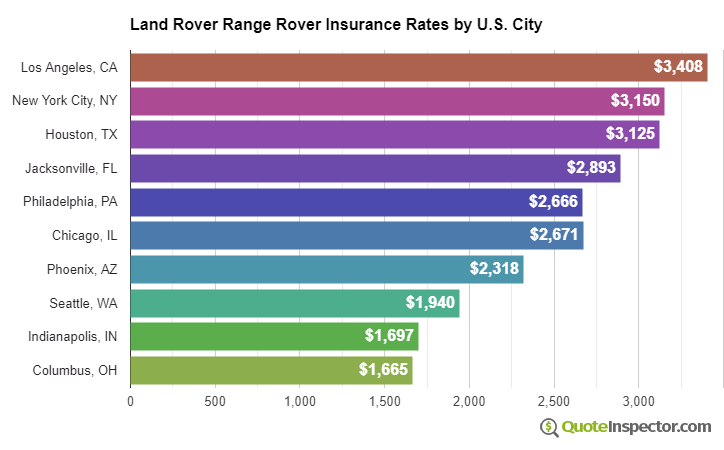
Price Range by Location
Living in a larger city has a significant impact on car insurance prices. Rural locations tend to have a lower frequency of comprehensive and collision claims than congested cities.
The price range example below illustrates how where you live affects auto insurance prices.
These examples highlight why anyone shopping for car insurance should get quotes using their specific location and risk profile, rather than relying on rate averages.
Use the form below to get customized rates for your location.
Enter your zip code below to view companies based on your location that have cheap auto insurance rates.
Detailed Rate Analysis
The chart below breaks down estimated Land Rover Range Rover insurance rates for additional coverage and risk scenarios.
- The best full coverage rate is $959
- Choosing higher $1,000 deductibles can save $246 every year
- The average rate for a 40-year-old driver who chooses $500 deductibles is $1,700
- Buying more expensive low deductibles for comp and collision coverage will increase the cost to $2,180
- High-risk insureds with multiple tickets or accidents could pay around $3,692 or more
- The cost for full coverage for a teen driver with full coverage can cost $6,232 each year
Auto insurance rates for a Land Rover Range Rover can also vary considerably based on your driver profile, the model of your Range Rover, and physical damage deductibles and liability limits.
An older driver with a good driving record and high deductibles could pay as little as $1,600 annually on average for full coverage. Rates are highest for teen drivers, where even good drivers will have to pay in the ballpark of $6,200 a year. View Rates by Age
Where you live plays a big part in determining prices for Land Rover Range Rover insurance rates. A good driver about age 40 could pay as low as $1,310 a year in states like Vermont, New Hampshire, and Missouri, or at least $2,430 on average in Louisiana, New York, and Michigan.
| State | Premium | Compared to U.S. Avg | Percent Difference |
|---|---|---|---|
| Alabama | $1,538 | -$162 | -9.5% |
| Alaska | $1,304 | -$396 | -23.3% |
| Arizona | $1,410 | -$290 | -17.1% |
| Arkansas | $1,700 | -$0 | 0.0% |
| California | $1,938 | $238 | 14.0% |
| Colorado | $1,624 | -$76 | -4.5% |
| Connecticut | $1,748 | $48 | 2.8% |
| Delaware | $1,924 | $224 | 13.2% |
| Florida | $2,128 | $428 | 25.2% |
| Georgia | $1,568 | -$132 | -7.8% |
| Hawaii | $1,222 | -$478 | -28.1% |
| Idaho | $1,150 | -$550 | -32.4% |
| Illinois | $1,266 | -$434 | -25.5% |
| Indiana | $1,282 | -$418 | -24.6% |
| Iowa | $1,148 | -$552 | -32.5% |
| Kansas | $1,614 | -$86 | -5.1% |
| Kentucky | $2,320 | $620 | 36.5% |
| Louisiana | $2,516 | $816 | 48.0% |
| Maine | $1,050 | -$650 | -38.2% |
| Maryland | $1,404 | -$296 | -17.4% |
| Massachusetts | $1,360 | -$340 | -20.0% |
| Michigan | $2,956 | $1,256 | 73.9% |
| Minnesota | $1,424 | -$276 | -16.2% |
| Mississippi | $2,038 | $338 | 19.9% |
| Missouri | $1,510 | -$190 | -11.2% |
| Montana | $1,826 | $126 | 7.4% |
| Nebraska | $1,338 | -$362 | -21.3% |
| Nevada | $2,038 | $338 | 19.9% |
| New Hampshire | $1,226 | -$474 | -27.9% |
| New Jersey | $1,898 | $198 | 11.6% |
| New Mexico | $1,506 | -$194 | -11.4% |
| New York | $1,792 | $92 | 5.4% |
| North Carolina | $980 | -$720 | -42.4% |
| North Dakota | $1,390 | -$310 | -18.2% |
| Ohio | $1,174 | -$526 | -30.9% |
| Oklahoma | $1,746 | $46 | 2.7% |
| Oregon | $1,558 | -$142 | -8.4% |
| Pennsylvania | $1,622 | -$78 | -4.6% |
| Rhode Island | $2,270 | $570 | 33.5% |
| South Carolina | $1,540 | -$160 | -9.4% |
| South Dakota | $1,434 | -$266 | -15.6% |
| Tennessee | $1,488 | -$212 | -12.5% |
| Texas | $2,048 | $348 | 20.5% |
| Utah | $1,260 | -$440 | -25.9% |
| Vermont | $1,166 | -$534 | -31.4% |
| Virginia | $1,020 | -$680 | -40.0% |
| Washington | $1,314 | -$386 | -22.7% |
| West Virginia | $1,558 | -$142 | -8.4% |
| Wisconsin | $1,178 | -$522 | -30.7% |
| Wyoming | $1,516 | -$184 | -10.8% |
Opting for high physical damage deductibles can save as much as $730 each year, while increasing your policy's liability limits will push rates upward. Changing from a 50/100 limit to a 250/500 limit will cost as much as $411 extra every year. View Rates by Deductible or Liability Limit
If you like to drive fast or tend to cause accidents, you are likely paying anywhere from $2,000 to $2,700 in extra premium per year, depending on your age. High-risk driver insurance ranges anywhere from 43% to 132% more than the average rate. View High Risk Driver Rates
With so much variability in rates, the best way to figure out who has the best auto insurance rates is to compare rates from as many companies as possible. Each auto insurer utilizes a different rate formula, and quoted rates can be significantly different from one company to the next.
| Model Year | Comprehensive | Collision | Liability | Total Premium |
|---|---|---|---|---|
| 2024 Land Rover Range Rover | $490 | $900 | $390 | $1,938 |
| 2023 Land Rover Range Rover | $470 | $894 | $398 | $1,920 |
| 2022 Land Rover Range Rover | $454 | $872 | $416 | $1,900 |
| 2021 Land Rover Range Rover | $438 | $836 | $430 | $1,862 |
| 2020 Land Rover Range Rover | $414 | $806 | $442 | $1,820 |
| 2019 Land Rover Range Rover | $398 | $748 | $452 | $1,756 |
| 2018 Land Rover Range Rover | $382 | $704 | $456 | $1,700 |
| 2017 Land Rover Range Rover | $366 | $632 | $460 | $1,616 |
Rates are averaged for all Land Rover Range Rover models and trim levels. Rates assume a 40-year-old male driver, full coverage with $500 deductibles, and a clean driving record.
How to Find More Affordable Land Rover Range Rover Insurance
Saving money on Land Rover Range Rover insurance takes being a good driver, having good credit, not filing small claims, and not having any coverage lapses. Take the time to comparison shop every couple of years by getting rate quotes from direct car insurance companies like GEICO and Progressive, and also from insurance agencies where you live.
The following list is a summary of the material that was touched on in the above illustrations.
- Drivers who purchase an increased level of liability coverage will pay around $500 per year to raise limits from a minimum limit to 250/500 limits
- Drivers age 16 to 20 have the highest car insurance rates, as much as $519 per month if they have full coverage
- High-risk drivers who have multiple accidents or major violations could be forced to pay on average $1,990 more per year than a safer driver
- Increasing deductibles can save around $725 each year
Rate Tables and Charts
Rates by Driver Age
| Driver Age | Premium |
|---|---|
| 16 | $6,232 |
| 20 | $3,926 |
| 30 | $1,782 |
| 40 | $1,700 |
| 50 | $1,550 |
| 60 | $1,520 |
Full coverage, $500 deductibles
Rates by Deductible
| Deductible | Premium |
|---|---|
| $100 | $2,180 |
| $250 | $1,958 |
| $500 | $1,700 |
| $1,000 | $1,454 |
Full coverage, driver age 40
Rates by Liability Limit
| Liability Limit | Premium |
|---|---|
| 30/60 | $1,700 |
| 50/100 | $1,791 |
| 100/300 | $1,905 |
| 250/500 | $2,202 |
| 100 CSL | $1,837 |
| 300 CSL | $2,088 |
| 500 CSL | $2,270 |
Full coverage, driver age 40
Rates for High Risk Drivers
| Age | Premium |
|---|---|
| 16 | $8,932 |
| 20 | $6,258 |
| 30 | $3,782 |
| 40 | $3,692 |
| 50 | $3,522 |
| 60 | $3,492 |
Full coverage, $500 deductibles, two speeding tickets, and one at-fault accident
If a financial responsibility filing is required, the additional charge below may also apply.
Potential Rate Discounts
If you qualify for discounts, you may save the amounts shown below.
| Discount | Savings |
|---|---|
| Multi-policy | $93 |
| Multi-vehicle | $90 |
| Homeowner | $25 |
| 5-yr Accident Free | $130 |
| 5-yr Claim Free | $112 |
| Paid in Full/EFT | $81 |
| Advance Quote | $87 |
| Online Quote | $123 |
| Total Discounts | $741 |
Discounts are estimated and may not be available from every company or in every state.
Compare Rates and Save
Find companies with the cheapest rates in your area

